How can we help?
Portfolio Investments Page
The Portfolio Investments Page in Sharesight provides a summary of the holdings in the portfolio along with performance information for the selected date range.
Portfolio menu

Use the menu at the top of the screen to navigate through your portfolio.
This menu is dynamic. The specific options you see are determined by Portfolio Type (e.g., Individual Portfolio vs. Consolidated View vs. Shared Portfolio).
For example, a consolidated view does not have Task and Tax.
Tasks
Manage automated transactions such as dividends, splits or consolidations.
Tools
Find all the reports for performance, asset allocation, future income and dividend calendar.
Tax
Find all tax related reports.
Settings
Portfolio related settings. Sharing, email alerts, performance calculation method to trade confirmation email and manage integrations.
Switch between portfolios
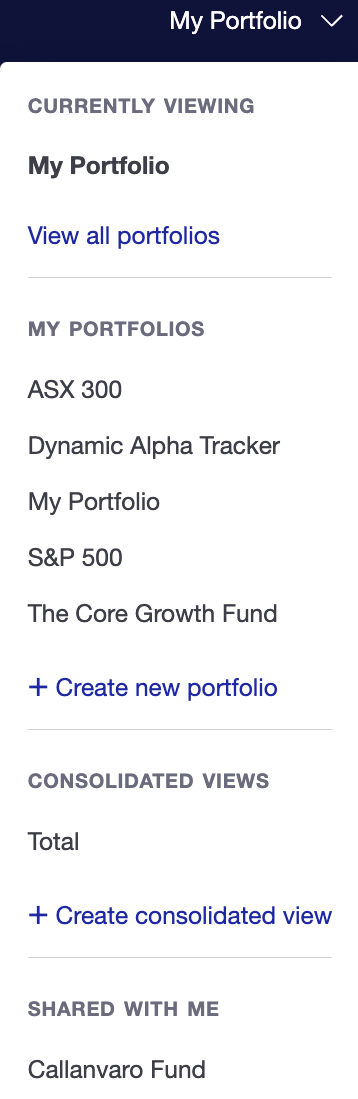
This menu lets you switch between portfolios or create a new portfolio.
Currently Viewing
You are in this portfolio.
My Portfolios
All the portfolios in the account. Or create a new portfolio.
Consolidated views
All the portfolio groups. Or create a new portfolio group.
Shared with me
Portfolios shared by another Sharesight user.
Account menu
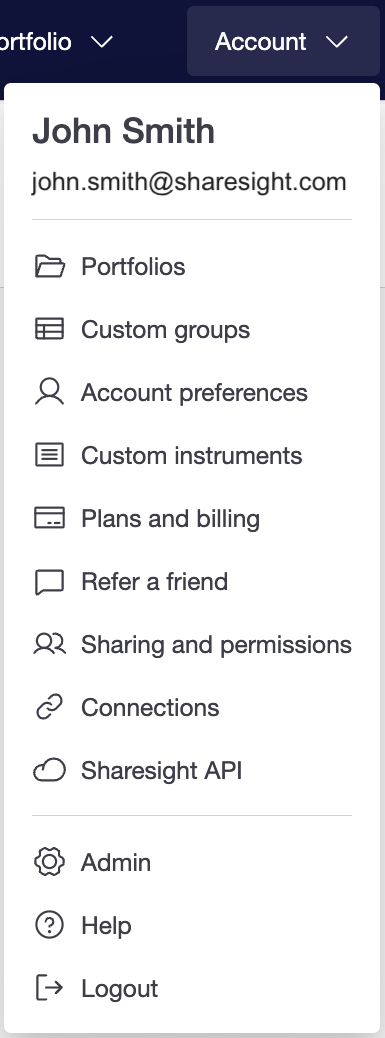
This menu give you access account settings and account level functionality:
Portfolios
View and manage all portfolios including sharing permissions, search holdings across portfolios, ownership, and access level for shared portfolios
Custom Groups
Group investments by criteria and attributes.
Account preference
Update account, personal or contact details.
Custom Instruments
Set up or manage unlisted assets such as property, private equity, or cryptocurrencies.
Plans and billing
Manage payment details and subscription plan.
Refer a friend
Get credit for referring a friend.
Sharing & Permissions
Manage all portfolios sharing permission. portfolios sharing settings
Connections
Manage Interactive Brokers and Desktop brokers integration.
Sharesight API
Manage all broker integrations and Sharesight API access.
Help
Access to help include help centre, forum, Youtube, and blogs.
Logout
Portfolio actions
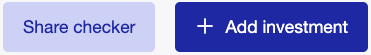
Share checker
Quick look up on the current price and performance return of an investment.
Add investment
Add a cash account or investment manually, from broker, or spreadsheet file.
Portfolio filters

This shows the option to select date range, group investments, include or exclude sold positions and show or hide graph.
Date range
Choose from default date options or a custom period.
Grouping by
Select setting for organising the holdings.
Include closed positions
Include or exclude the performance of sold (realised gains) positions.
Show graph
Select to display or hide all graphs.
Portfolio summary
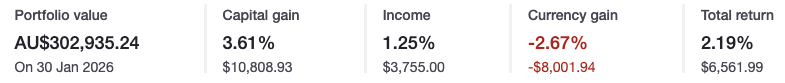
See the total impact made by capital gains, dividends and currency movements for the selected date range.
To understand how capital gains, dividends, currency gain, and total return are calculated, see Components of return.
Portfolio value
The total value of the portfolio including cash balance in portfolio currency.
Capital gain
The portfolio capital gain in both dollar and percentage for the selected period.
Income
Dividends and income received in both dollar and percentage for the selected period.
Currency gain
Currency movement in both dollar and percentage for the selected period.
Total return
The portfolio return in both dollar and percentage for the selected period.
Graph
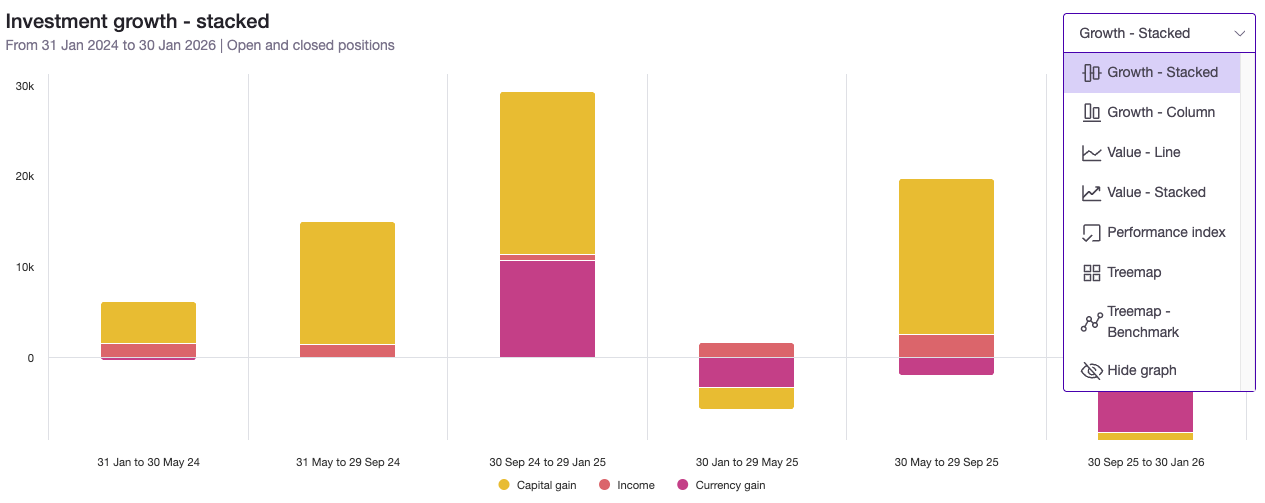
Our portfolio graphs allow you to visualize your financial data through three lenses: the specific drivers of your growth, the total value of your wealth over time, and your performance relative to market benchmarks. These views range from detailed bar and line charts to heat-mapped treemaps that highlight your biggest winners and losers at a glance.
Growth - Stacked
Visualises the total composition of your returns by layering capital gains, income, and currency movements into a single vertical bar for each period.
Growth - Column
Compares the individual impact of capital gains, income, and currency side-by-side to show which specific factor drove your performance.
Value - Line
Tracks the total market value of your holdings plus your cash balance as a continuous trend over time.
Value - Stacked
Displays the total value of your portfolio as a filled area, illustrating how the proportion of invested assets versus cash contributes to your total wealth.
Performance Index
Standardises your portfolio's return against a benchmark by starting both at a baseline of 10,000 points, making it easy to compare relative percentage growth.
Treemap
Provides a bird's-eye view of your portfolio where the size of each tile represents the holding’s weight and the colour intensity indicates the scale of its gains or losses.
Treemap - Benchmark
Displays your holdings relative to a benchmark, using color to highlight whether an individual asset is outperforming or underperforming the market average.
Benchmark
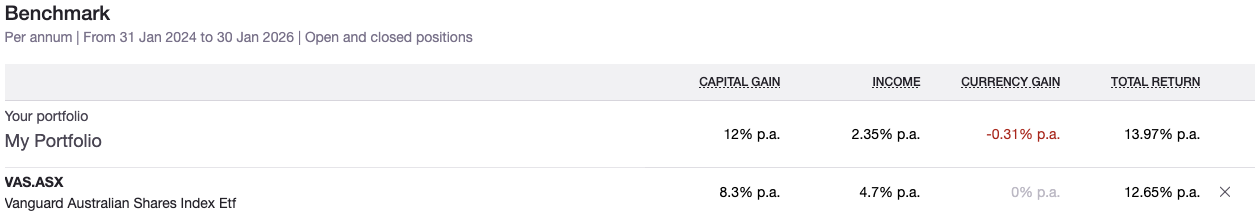
Compare portfolio performance against a benchmark i.e. index, ETF, or investment.
Investment table settings
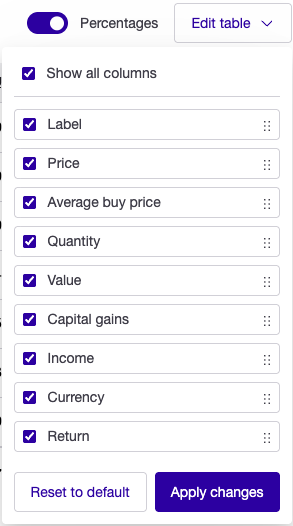
Percentages
View investments return by percentages or by dollar.
Edit table
The option to sort, include or exclude data (labels, average buy price, price, quantity, value, capital gains, income, currency, and return) columns.
Investments table
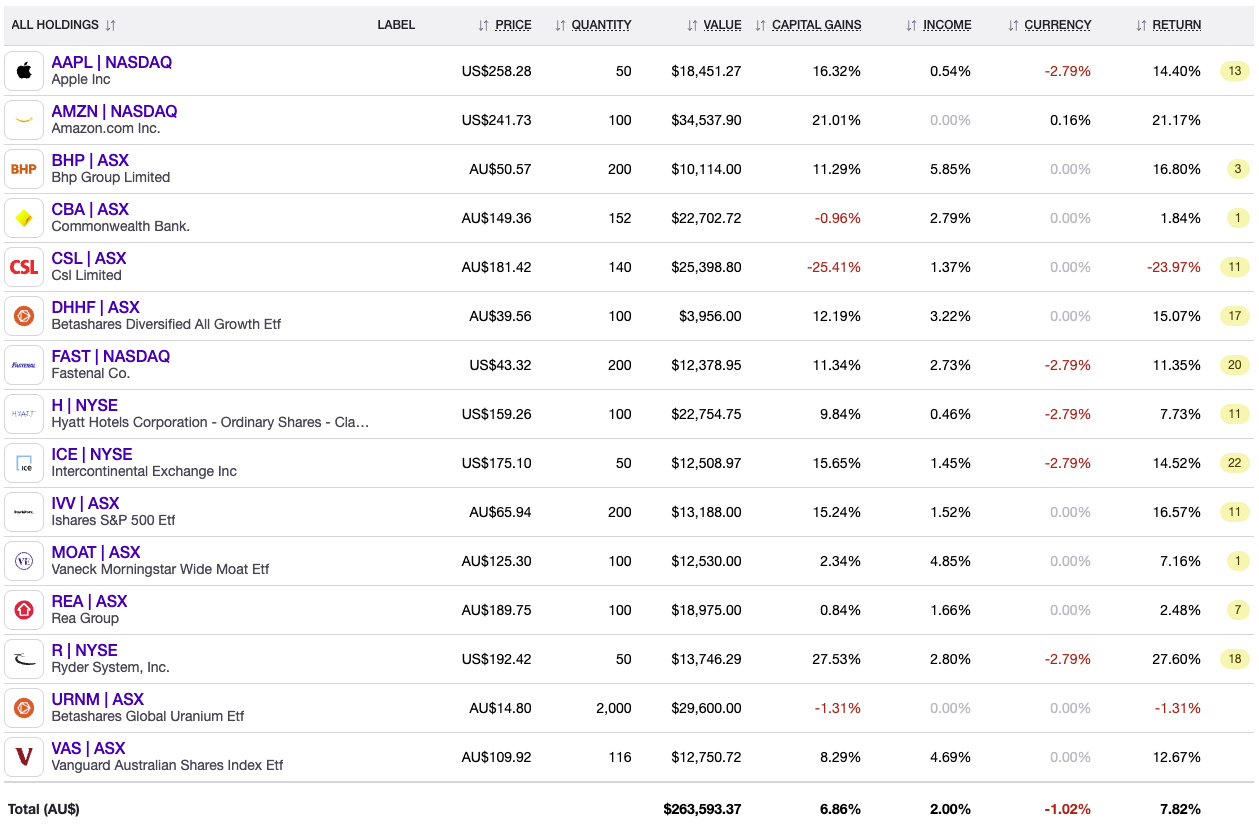
The investment table provides a comprehensive breakdown of your individual holdings, most recent price (or price on the selected end date), quantity, market value and performance return.
All holdings
Shows investment name, ticker symbol, listed exchange and investment logo.
Label
Tags added to an investment.
Price
The current price or the closing price of the selected end date.
Avg. buy price
The average price of all shares purchased, inclusive of reinvested dividends and adjusted for splits and consolidations.
Quantity
Current number of units or shares owned.
Value
Total market value of the investment.
Capital gains
The investment capital gain in both dollar and percentage for the selected period. Either in unrealised profit or both realised and unrealised profit.
Income
Dividends and income received in both dollar and percentage for the selected period.
Currency
Currency movement in both dollar and percentage for the selected period.
Return
The total return of the holding over the selected period.
Unconfirmed Transactions
The number in the orange box is the unconfirmed transactions for the holding.
Cash accounts
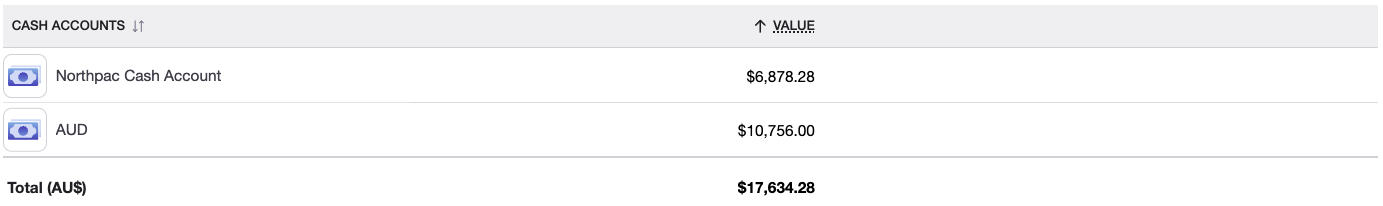
View a list of your cash accounts and their real-time balances, converted into your portfolio's base currency.
Manual cash account
Manually create cash accounts to track brokerage balances and automatically sync transaction data—including buys, sells, and dividends—across multiple accounts.
Xero cash account
Sync any Xero-supported bank feed to automatically track and display up-to-date cash balances directly within your portfolio.
Last updated 14th May 2026