How can we help?
Performance Report
The Performance Report within Sharesight allows you to report on your portfolio performance over any date range. Report options allow you to limit the report to open positions only, change the way your holdings are grouped, of filter the report using labels.
The selected holdings you are running the report on are organised in the holding table by a specified grouping, default is by market.
Subtotals are displayed for each grouping with overall performance totals shown at the bottom of the table.
The price, quantity and value figures are as of the end date selected for the report.
Running the Performance Report:
Embedded content: https://www.youtube.com/watch?v=ZxhN0yUGQaA
1 — From any page click on the ‘Report’ tab.

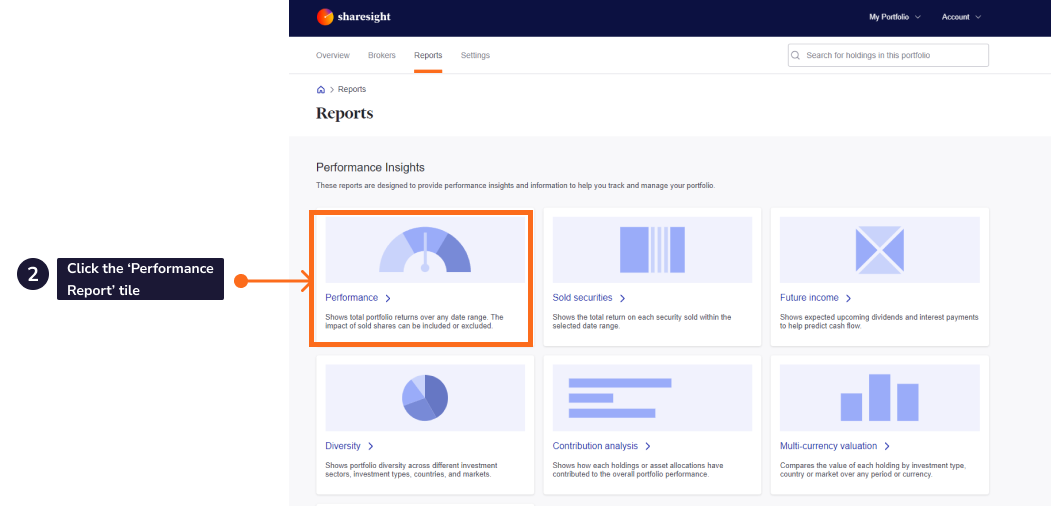
2 — Click the ‘Performance Report’ tile.
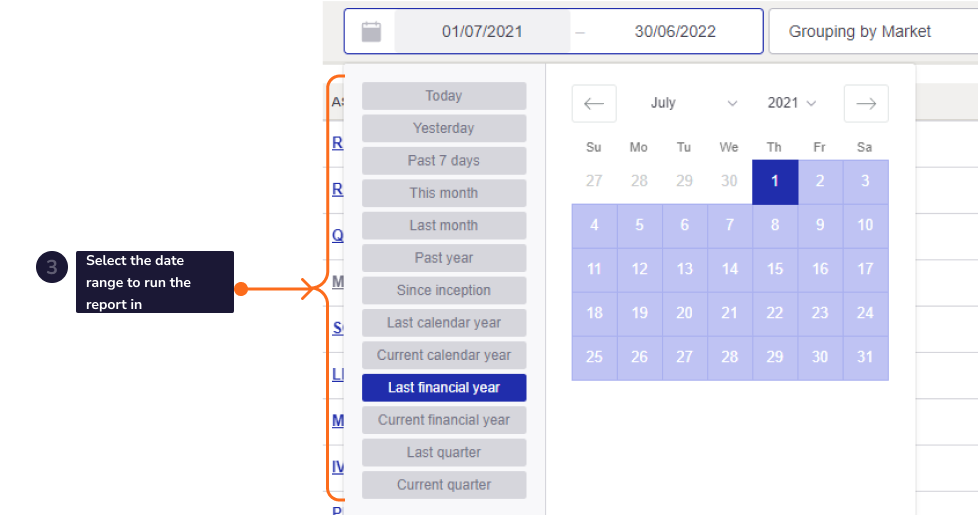
3 — From the dropdown calendar, select the date range you would like to run the report in.
4 — Click on the grouping dropdown menu to select a 'group'.
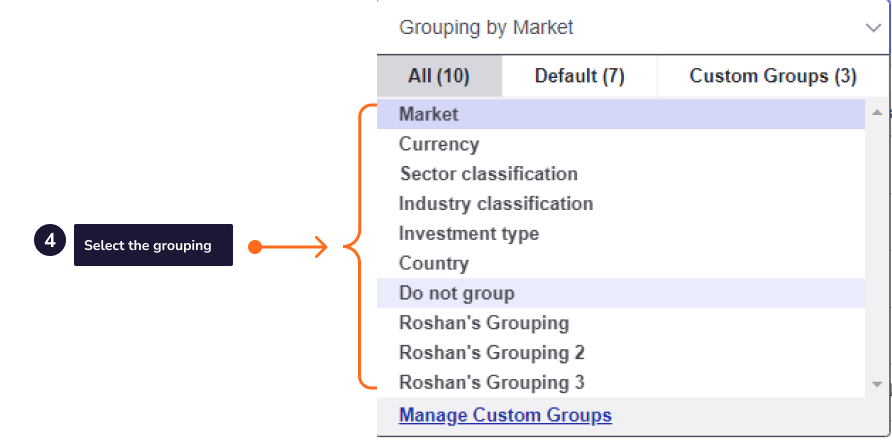
To select the grouping you wish to view the trades of your portfolio in:
- Market
- Currency
- Sector Classification
- Industry Classification
- Investment type
- Country
- Do not group (Holdings)
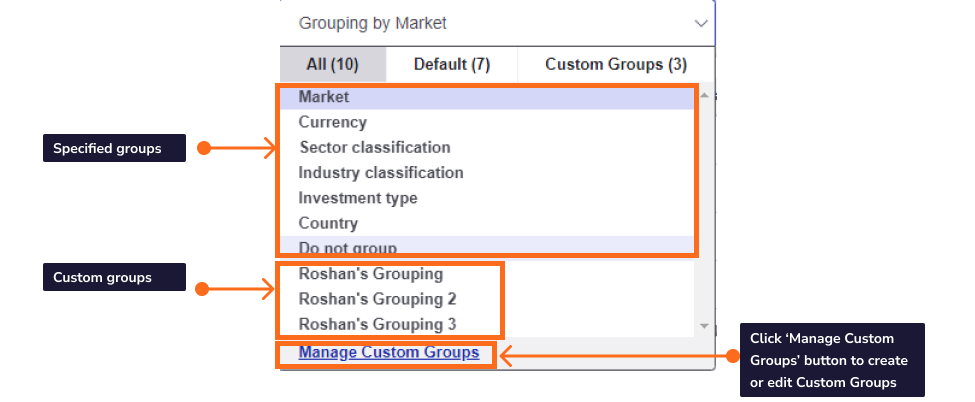
- Custom Group - If you have already created a Custom Group, you can view the holdings performance via your own organised specifications
If you haven’t already created a Custom Group, you can click the ‘Custom Group Settings’ to set up a Custom Group to organise your holdings into your own specifications.
You can also click ‘Manage Custom Groups’ to edit your Custom Group.
5 — In the ‘Filter by Label’ dropdown, in the ‘Manage’ selection, you have the option to report on specific subsets of holdings within a portfolio with the Labels feature. Using the labels in the Performance Report enable you filter holdings match a specific criterion. For example you could separately compare the performance of shares recommended by Broker A vs those recommended by Broker B.
If you have already created Labels, select the labels’ boxes which you want to report on.
If you haven’t already created Labels, click the ‘Manage’button to set up labels on holdings to only report on specific subset of holdings.
You can also click ‘Manage’ button to edit your Labels.
Note: The Label feature is only available on Standard, Premium and Sharesight Business plans. You can upgrade your plan to run this report with labels.

Click on the ‘Save’ button to apply your chosen settings.

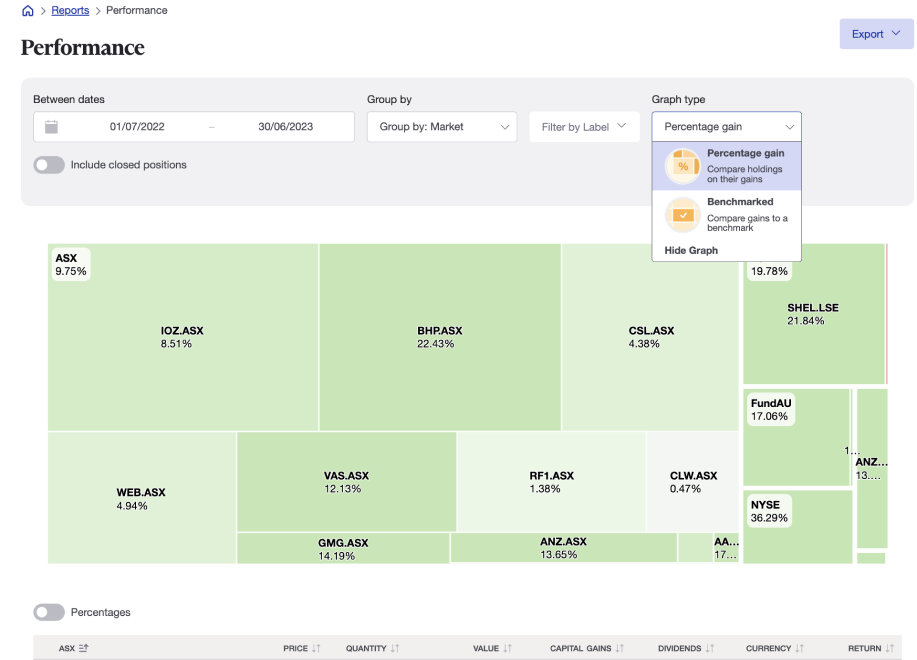
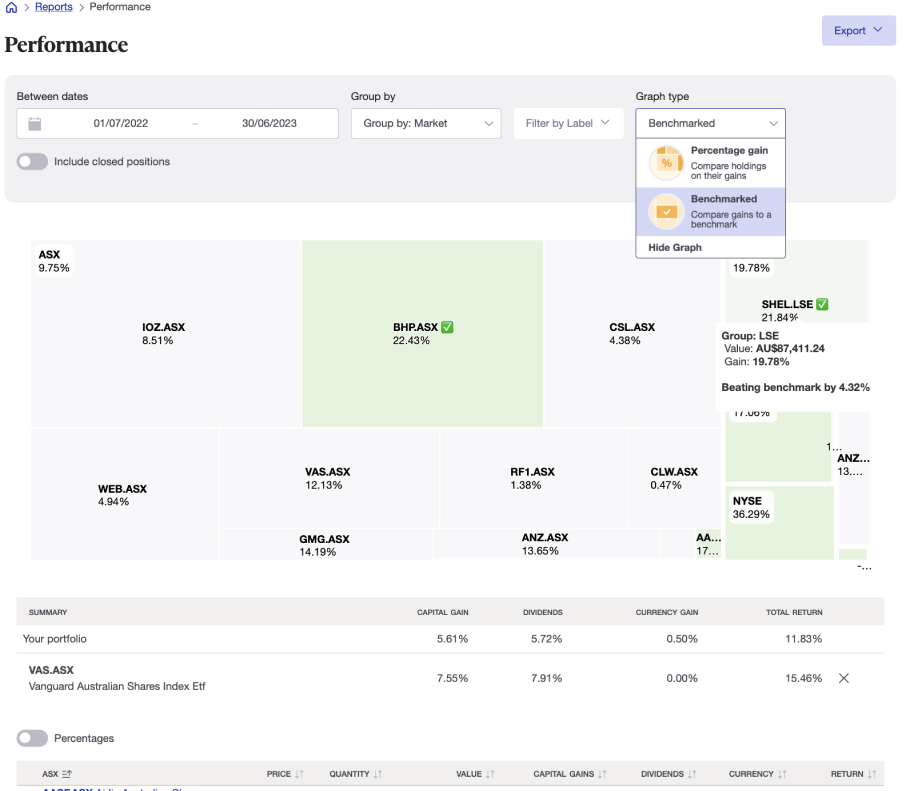
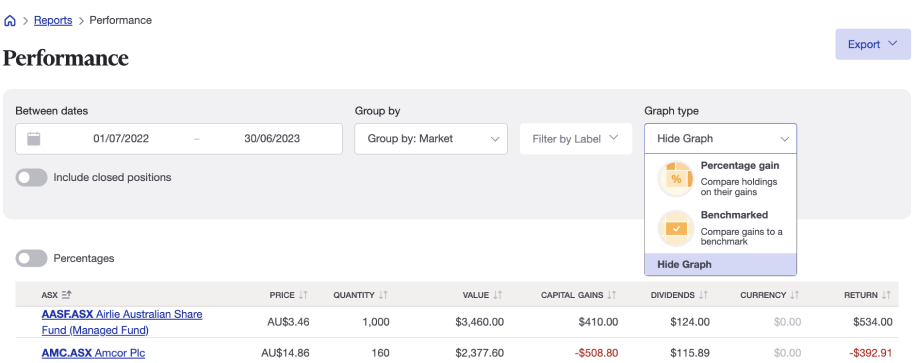
6 — Select the graph type you wish to set on the report.
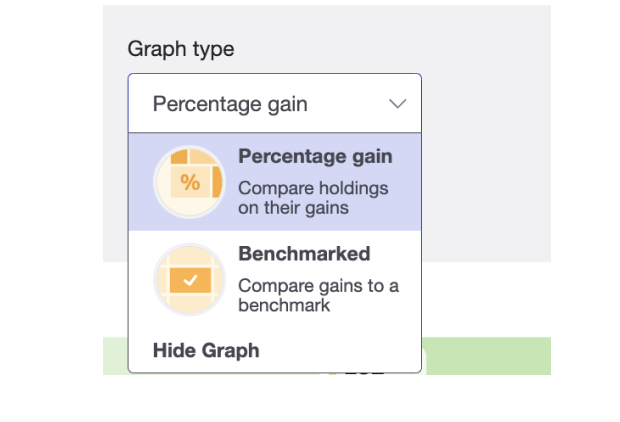
A. Percentage gain - compares the holding on their gains
B. Benchmarked - compares gain to the benchmark.
Select "Hide Graph" if you do not wish to apply the graph on the report.
7 — Toggle between ‘open positions (current holdings) or open & closed positions (includes sales)’.

8 — Click on the ‘Run report’ button to load the report with your chosen settings.
The holding table will reload with the selected date range, grouping and settings.
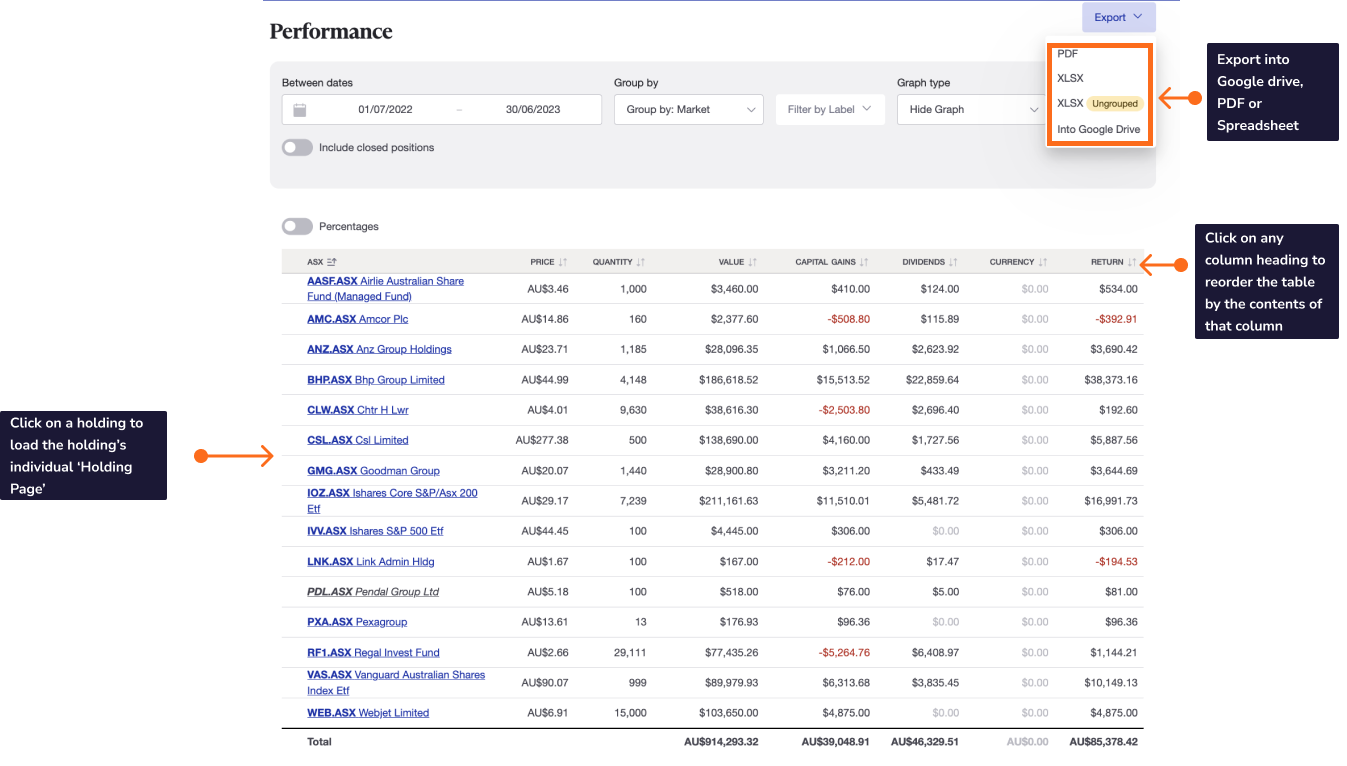
Click on any column heading to reorder the table by the contents of that column.
Click on a holding to load the holding’s Individual Holding Page.
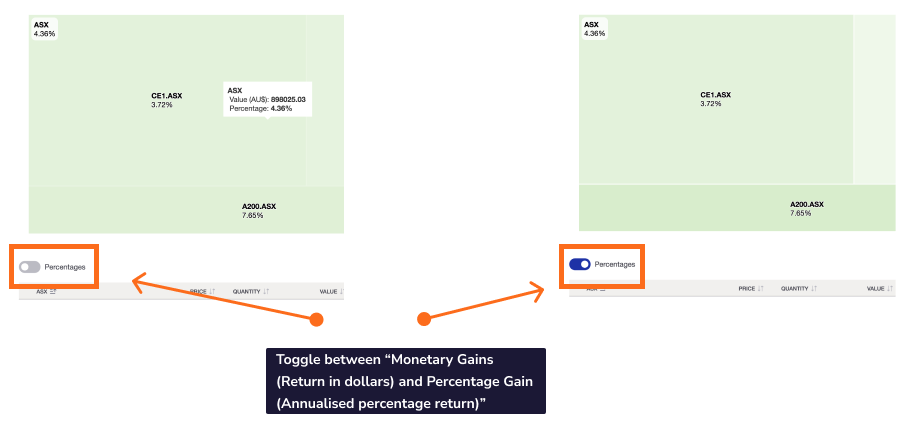
Toggle between ‘Monetary Gains' to view the returns in dollars and 'Percentage Gains to view the returns in annualised percentage return.
The Performance Report can be exported to Spreadsheet, PDF or into Google Drive.
Last updated 19th January 2026