How can we help?
Individual Holding Page
Each holding in your Sharesight portfolio has an Individual Holding Page where you can view all of the information relating to the holding. This page enables you to add and edit trades, adjustments and payouts, e.g. dividends or interest payments.
To access the Individual Holding Page, click on the holding name on the Portfolio Investments Page or search for the holding under the Holdings tab.
Important note: the performance figures at the top of this page relate only to the current holding (open position). You can run the Performance Report with the Include gains option selected to view the total return including gains from any sales, or run the Sold Securities Report to view gains from sales only.
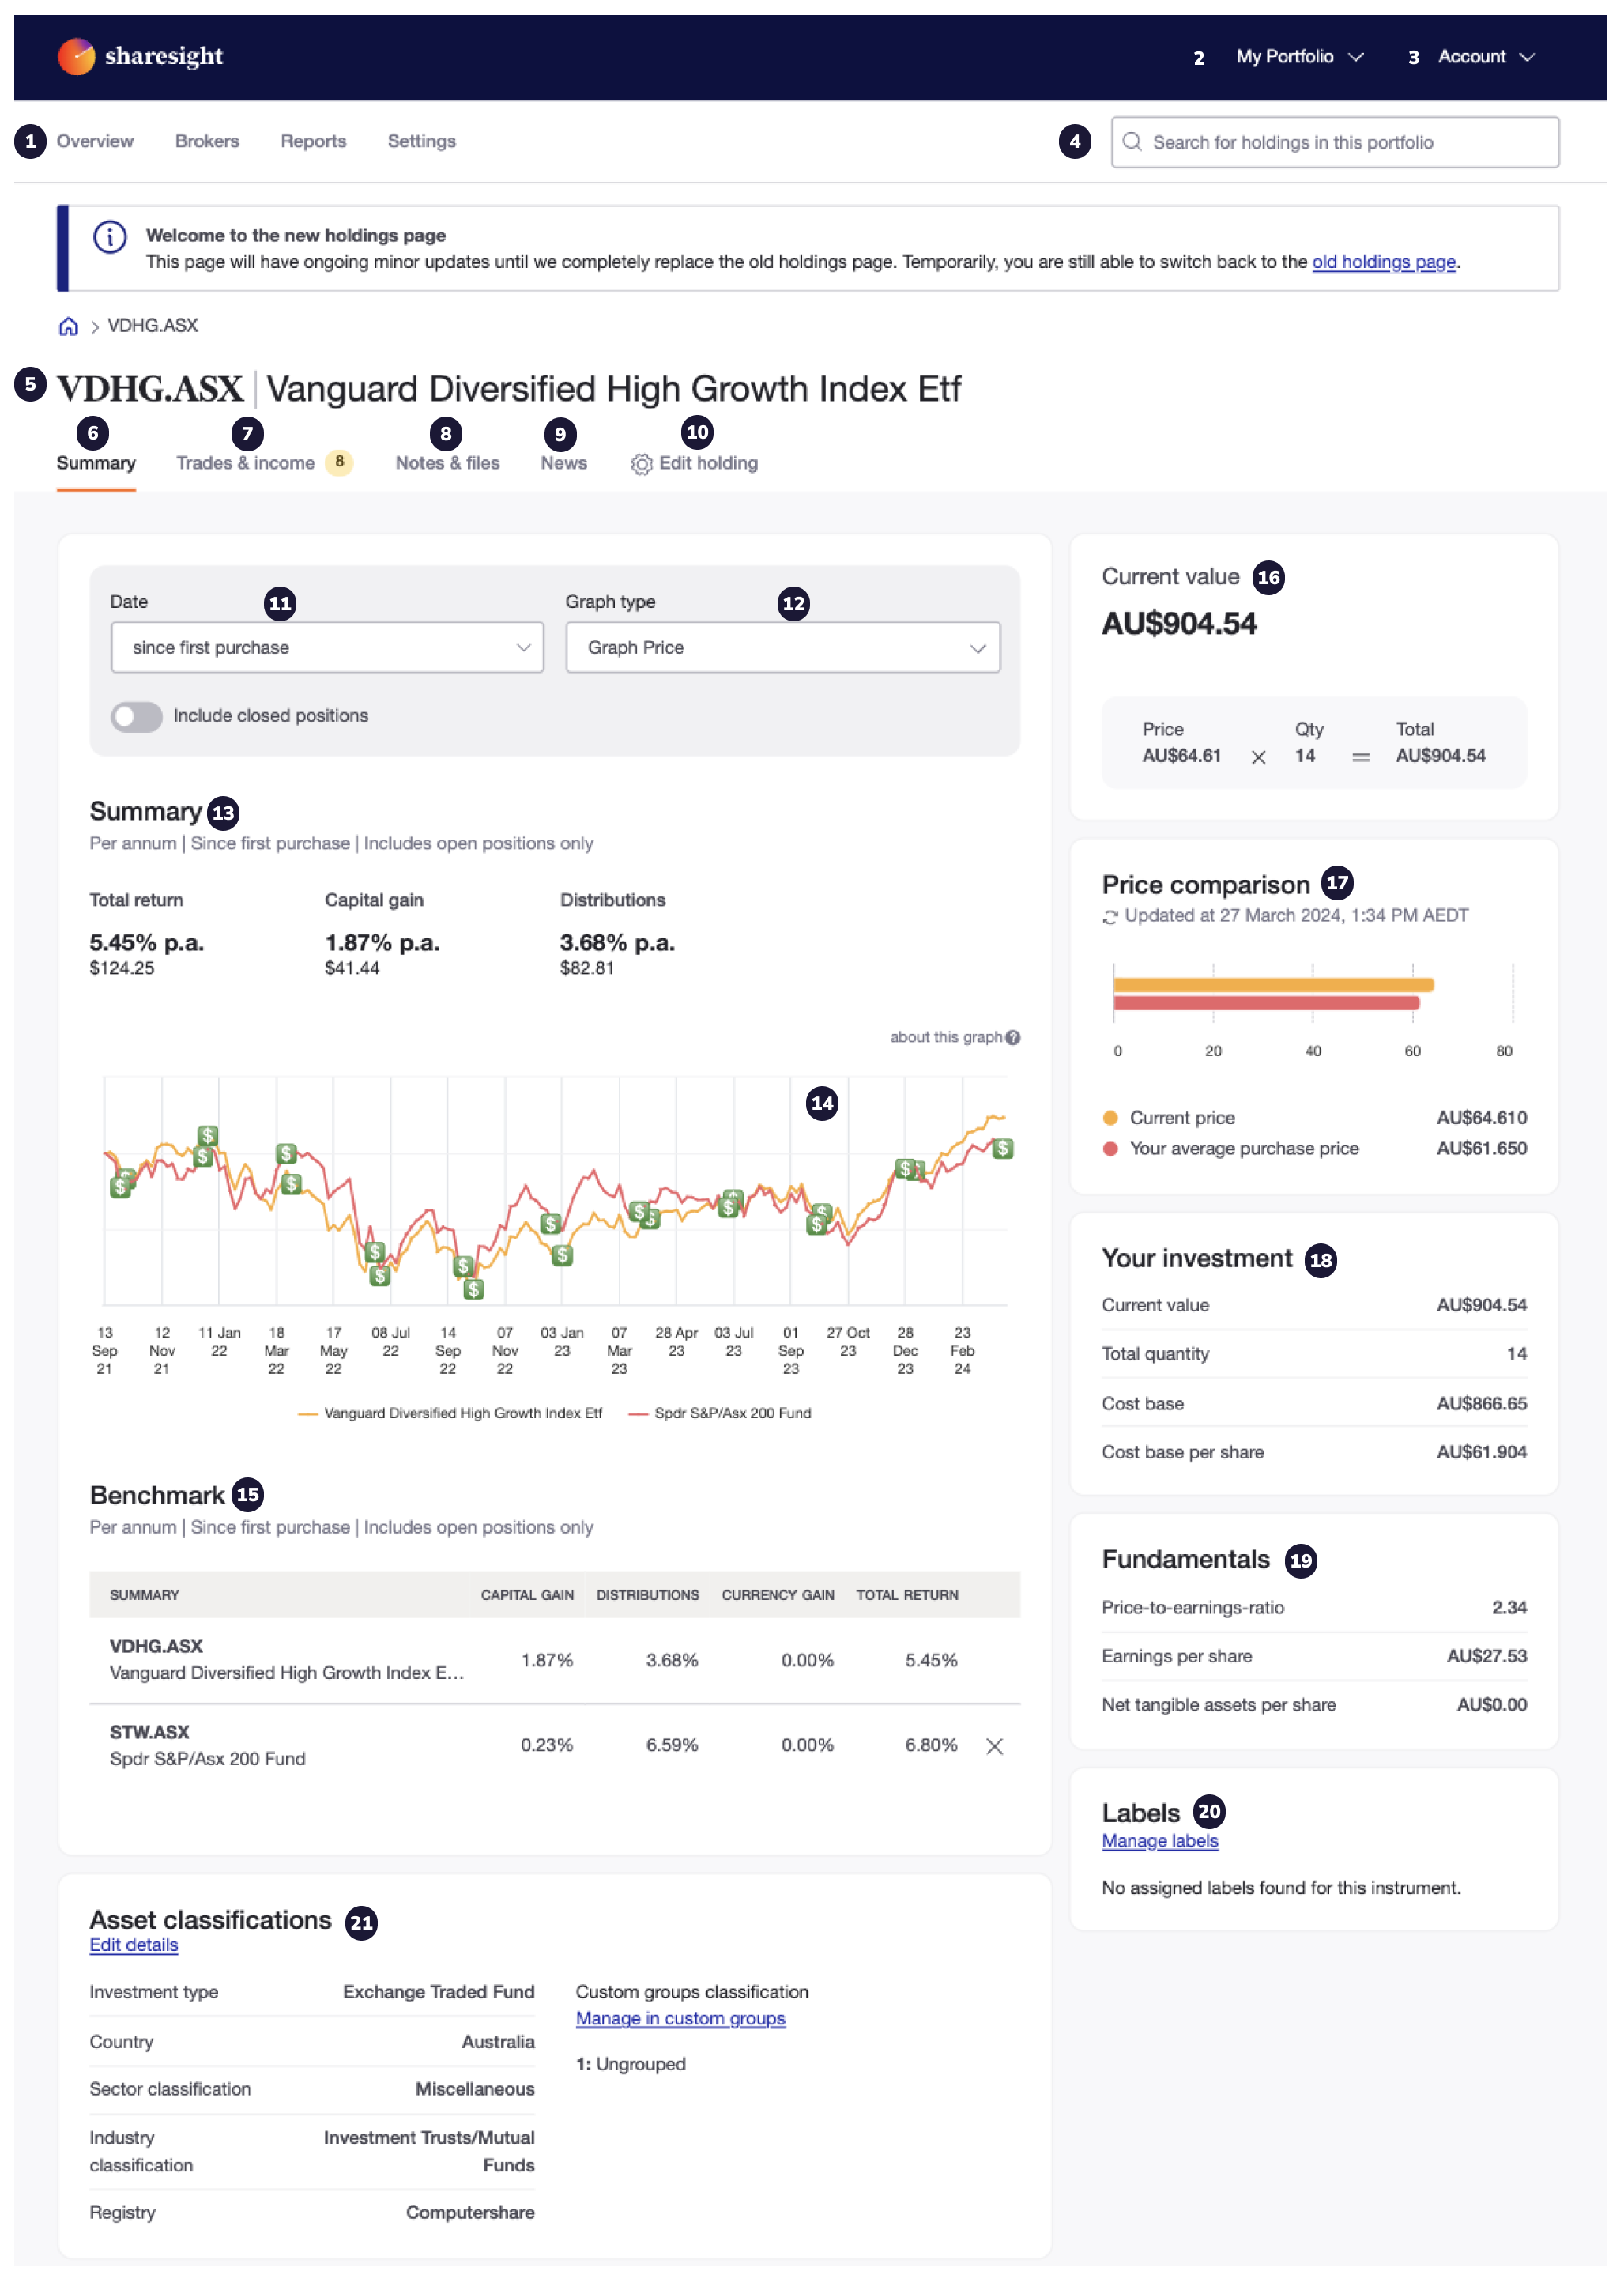
High-level navigation - The navigation tabs, portfolio dropdown menu, account settings menu, search bar, and holding name & code are shared across Sharesight; for a full breakdown see the Portfolio Investments Page.
Summary
This view contains the performance summary, graphs, portfolio value and number of units, benchmark, asset classification and other important information relavent to the holding.
Date range dropdown menu
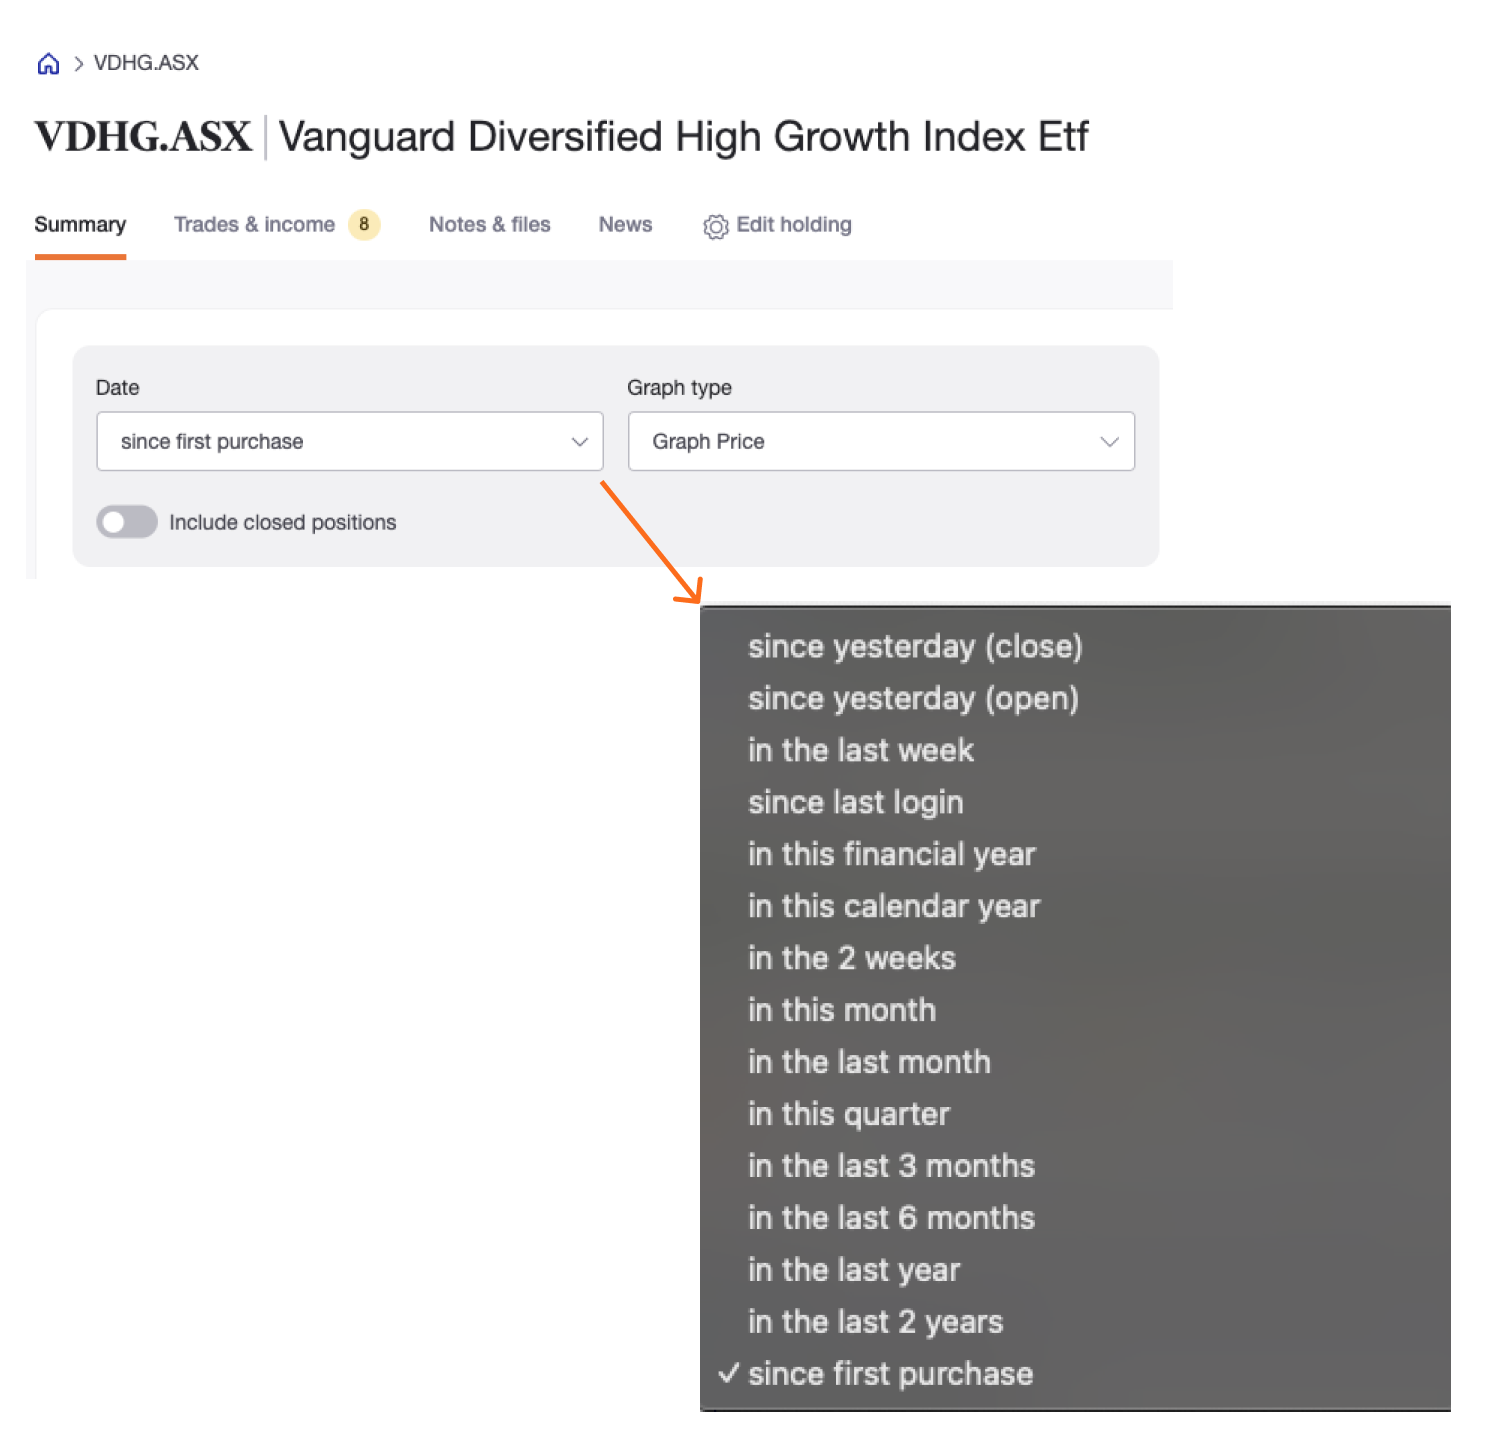
Choose the time period over which you wish to see the holding’s returns calculated.
Note: Selection criteria apply to the Summary Bar and Holding Graph.
Note: Sharesight currently updates ASX and NZX with 20 minute price delay and all other supported markets prices daily, shortly following the close of trading.
Since yesterday (open) Displays the gain since the start of trading for the previous day. This option will, therefore, display the price movement for the previous trading day if the current days prices have not yet been loaded, or for the previous two trading days if the current days prices have been loaded.
Since yesterday (close) Displays the gain since the previous day’s closing price. This option will return zero gain if the current days prices have not been loaded yet.
Holding Graph dropdown menu
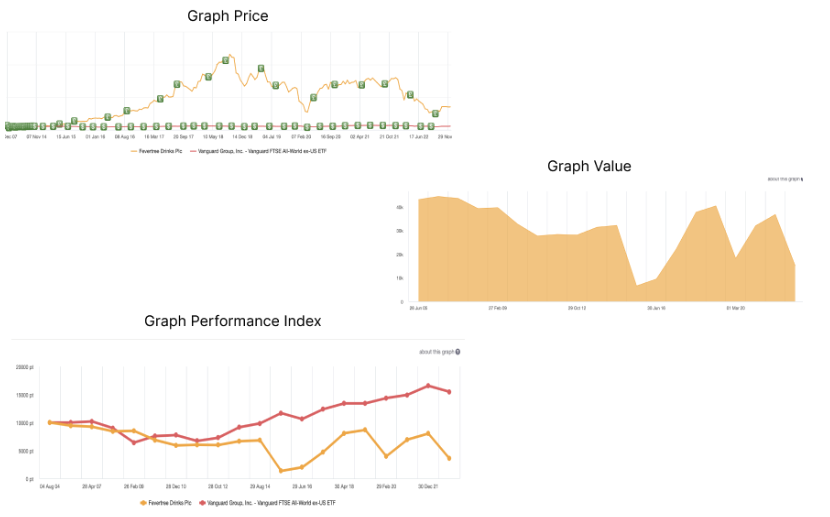
Select the graph to represent the holding performance within the selected date range.
Holding Summary
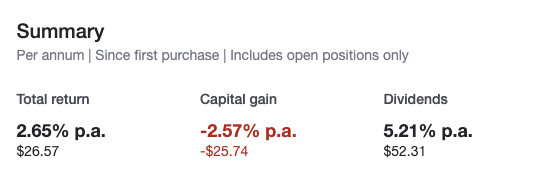
Displays the performance summary of the holding along with the monetary value and percentage p.a..
Total Return - The total return that has been achieved to date on currently held shares. It includes capital gains, dividends received and allows for the impact of currency movements if it is an overseas holding. If the date range is selected as 'since fist purchase', it is calculated from the first purchase date recorded for the holding. For any other date range it will pick up the market value of the report start date, based on the date range selected. Total return is shown in currency amount and as an annualised percentage.
Holding Graph
The graph plots the performance of the share against an appropriate benchmark such as NZX50 or ASX200 depending on the Stock Exchange that the holding is listed on.
Symbols on the graph mark corporate action events as follows:
 = Dividend Payment
 = Bonus Issue
 = Share Cancellation
 = Share Consolidation
 = Share Split
Benchmark
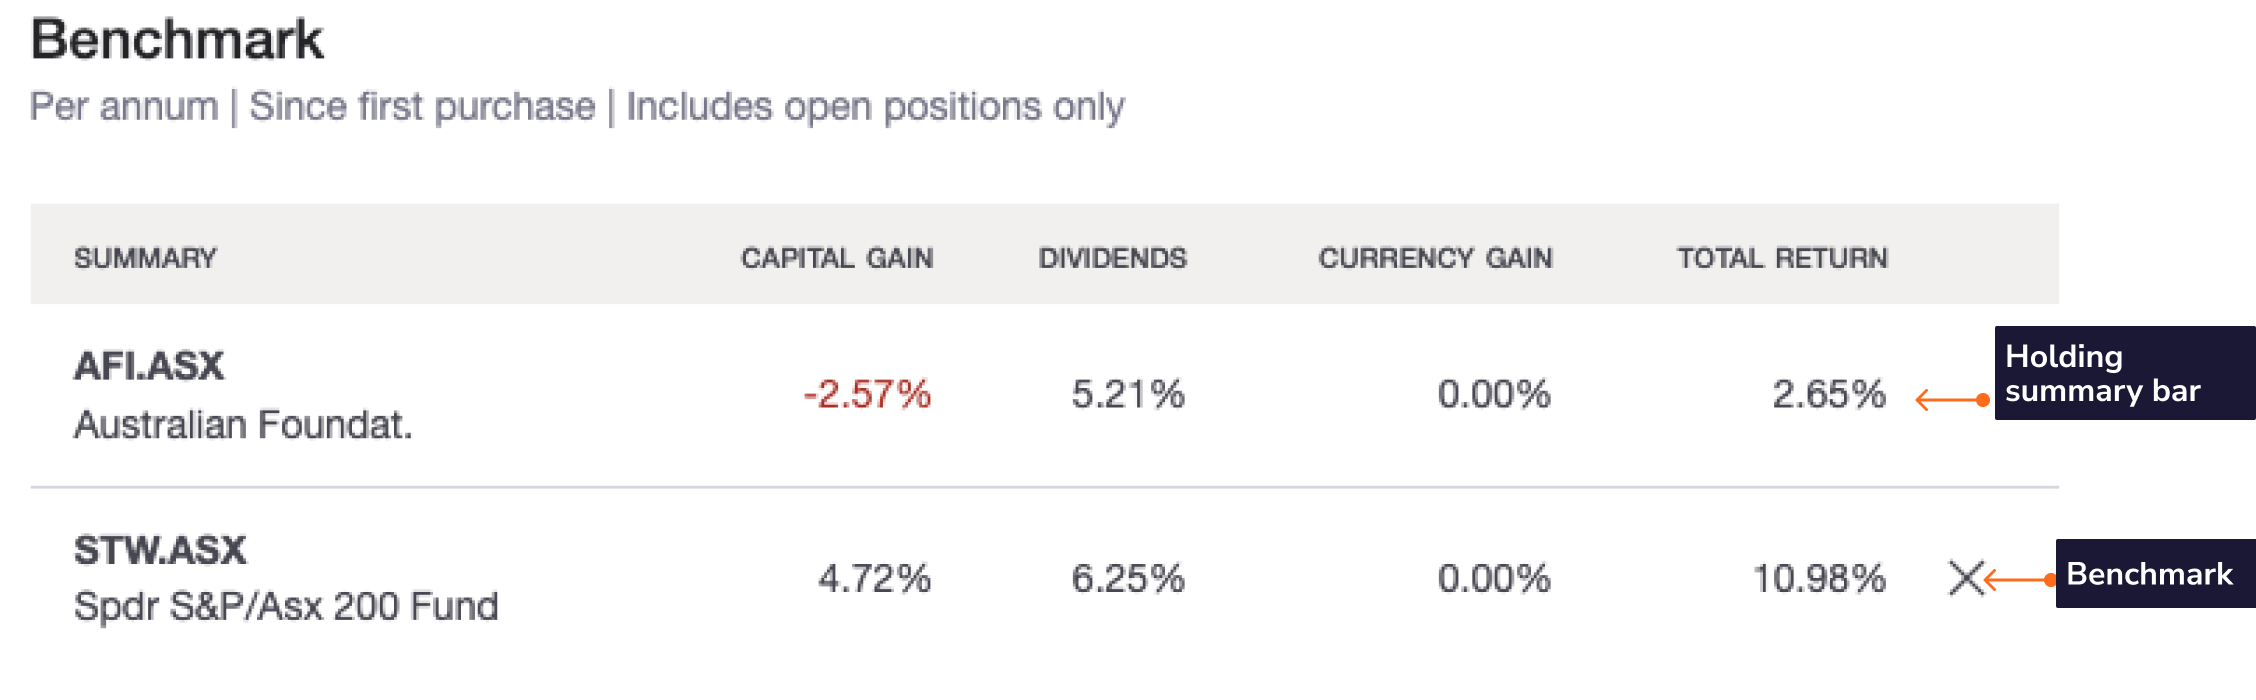
Set any ETF in Sharesight’s database to use for comparison against your portfolio. This feature will add an additional row to the summary bar, which allows you to compare the percentage return of your portfolio to the percentage return of the benchmark.
Current Value
The value of the holding based on today’s share prices (current price x current quantity, converted into your local currency if it is an overseas holding).
Note: The Holding summary is not affected by the date range selected.
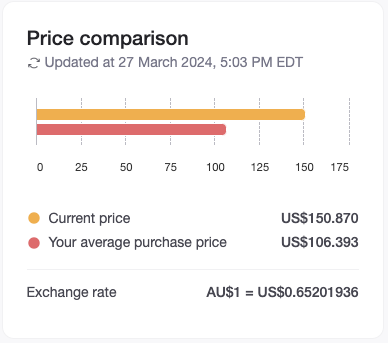
Price comparison
A visual representation of the average purchase price and current market price of the holding
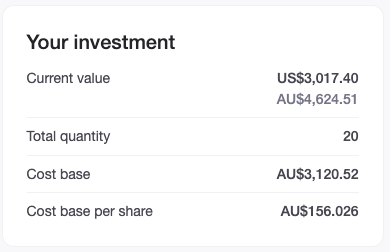
Your investment infrmation
Current Value - of holding in both the portfolio currency and holding currency (if an overseas holding).
Current Quantity - current number of shares owned.
Cost base p/share - Calculated by the holding’s cost base divided by quantity of shares. For holdings with multiple trades at different prices Sharesight calculates the cost base per share across all trades by the sale allocation method, average cost.
Note: For Australian portfolios, the sale allocation method can be changed in the Capital Gains Tax Report. See Sale Allocation Method to learn how each method works and how Sharesight tracks parcels across financial years. For New Zealand portfolios, the method can be changed in the Traders Tax Report.
Cost base - The holding’s current total value.
Fundamentals
Price to earning ratio, earnings per share and net tangible assets per share.
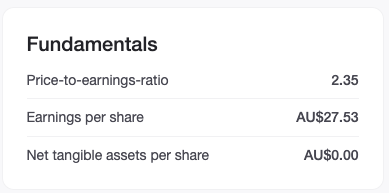
Note: This feature is only available for ASX and NZX holdings.
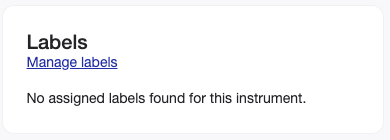
Labels
Manage and apply labels to your shares to customise your reports.
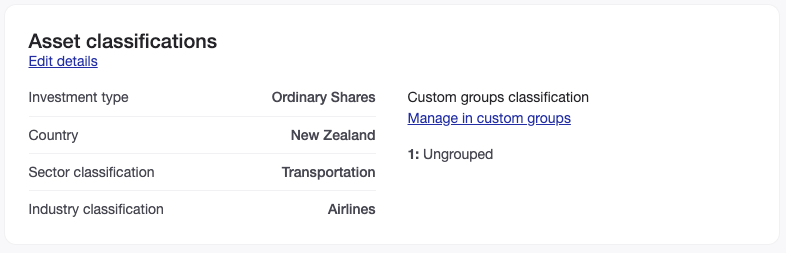
Asset classifications
Investment Type - displays investment categories and detailed description in brackets, for example; Interest Rate Securities (Fixed Rate Government Bond).
Country - country the company is registered in.
Sector Classification - the market field the holding is associated with.
Industry Classification - the field the holding is associated with. (Can be changed by selecting from the dropdown menu.)
Custom Grouping Classifications - If you have set up a Custom Grouping, this displays the group the holding is in. (This can be seen even when the Custom Grouping is not selected.
Trades & income
Displays all your buy and sell transactions and adjustments for the holding that you have recorded in Sharesight.
To add a new sale or purchase of shares or an adjustment, click the ‘Enter a New Trade’ button.
To edit a trade click ‘Edit’ on the appropriate trade or adjustment row.
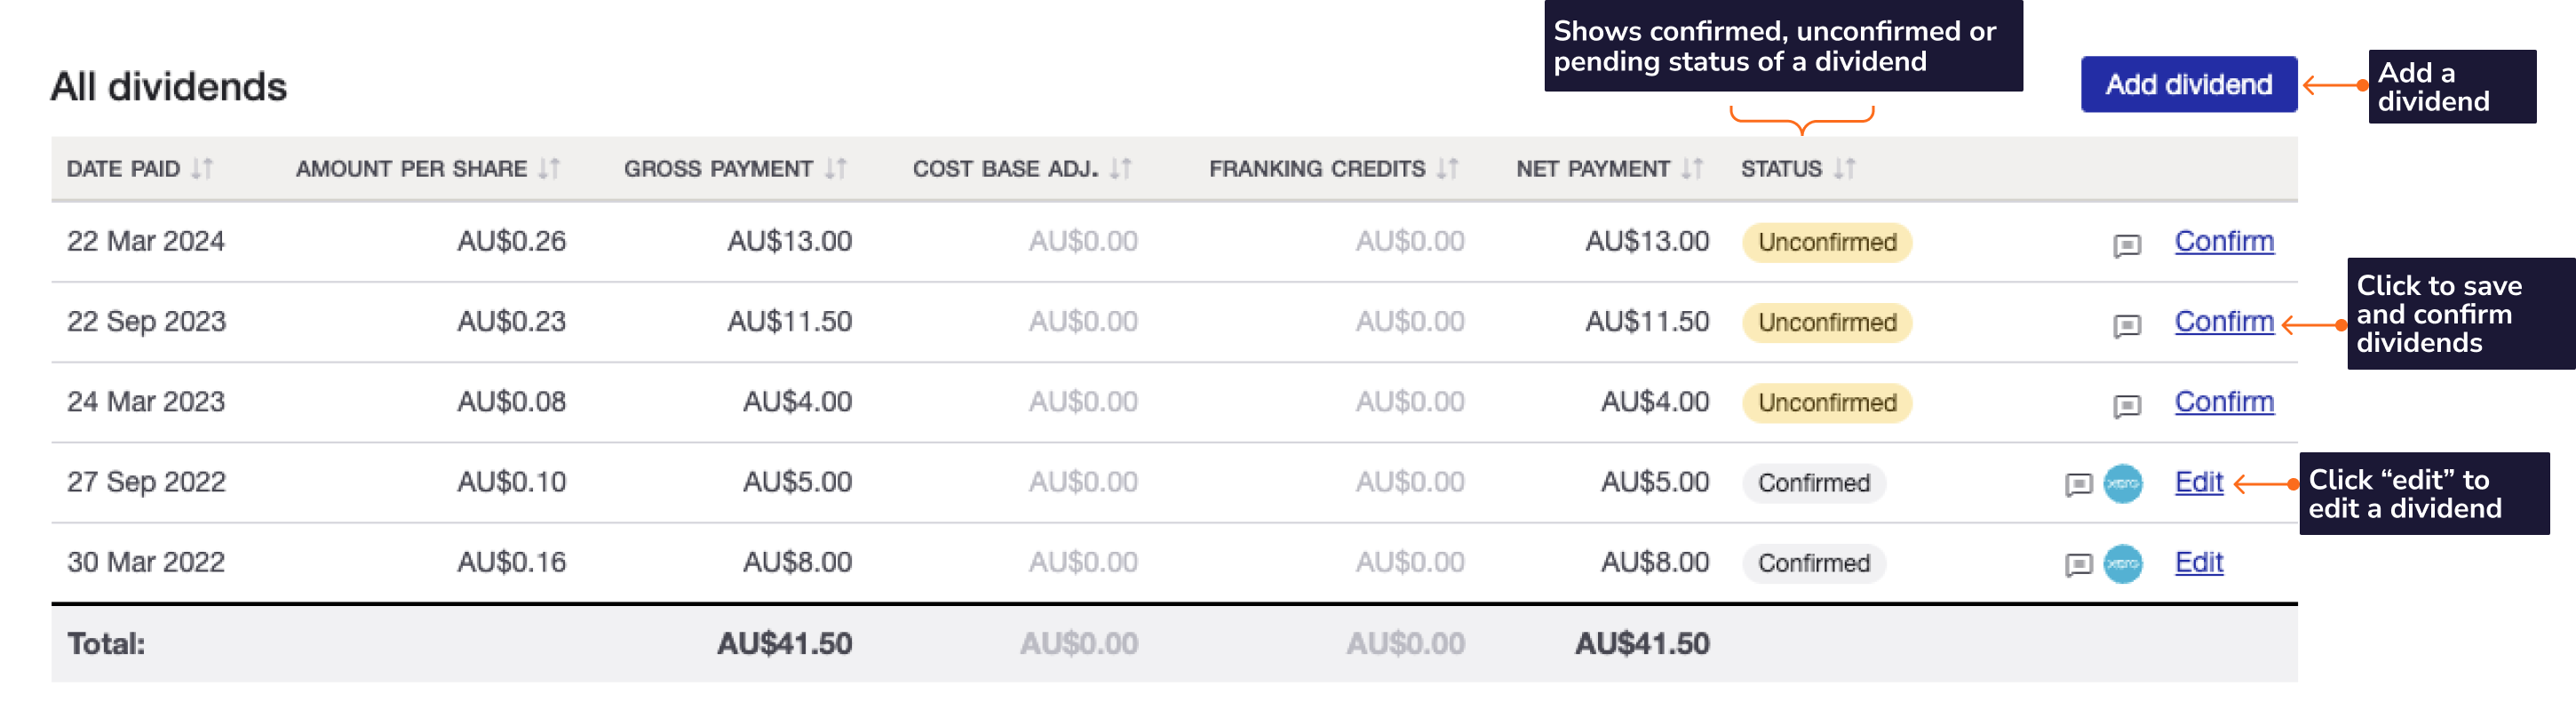
All dividends table - Displays all your dividends recorded for the holding.
Dividends are automatically entered for you by Sharesight. Automatically entered dividends shows Unconfirmed Status.
Note: Check and confirm your automatic dividends for accuracy, as they’re included in your Taxable Income Report.
To edit a dividend click ‘Edit’ on the appropriate dividend row.
To record a new dividend manually, click the ‘Add dividend’ button.
Review automatic transactions - Function button to confirm multiple unconfirmed transactions.

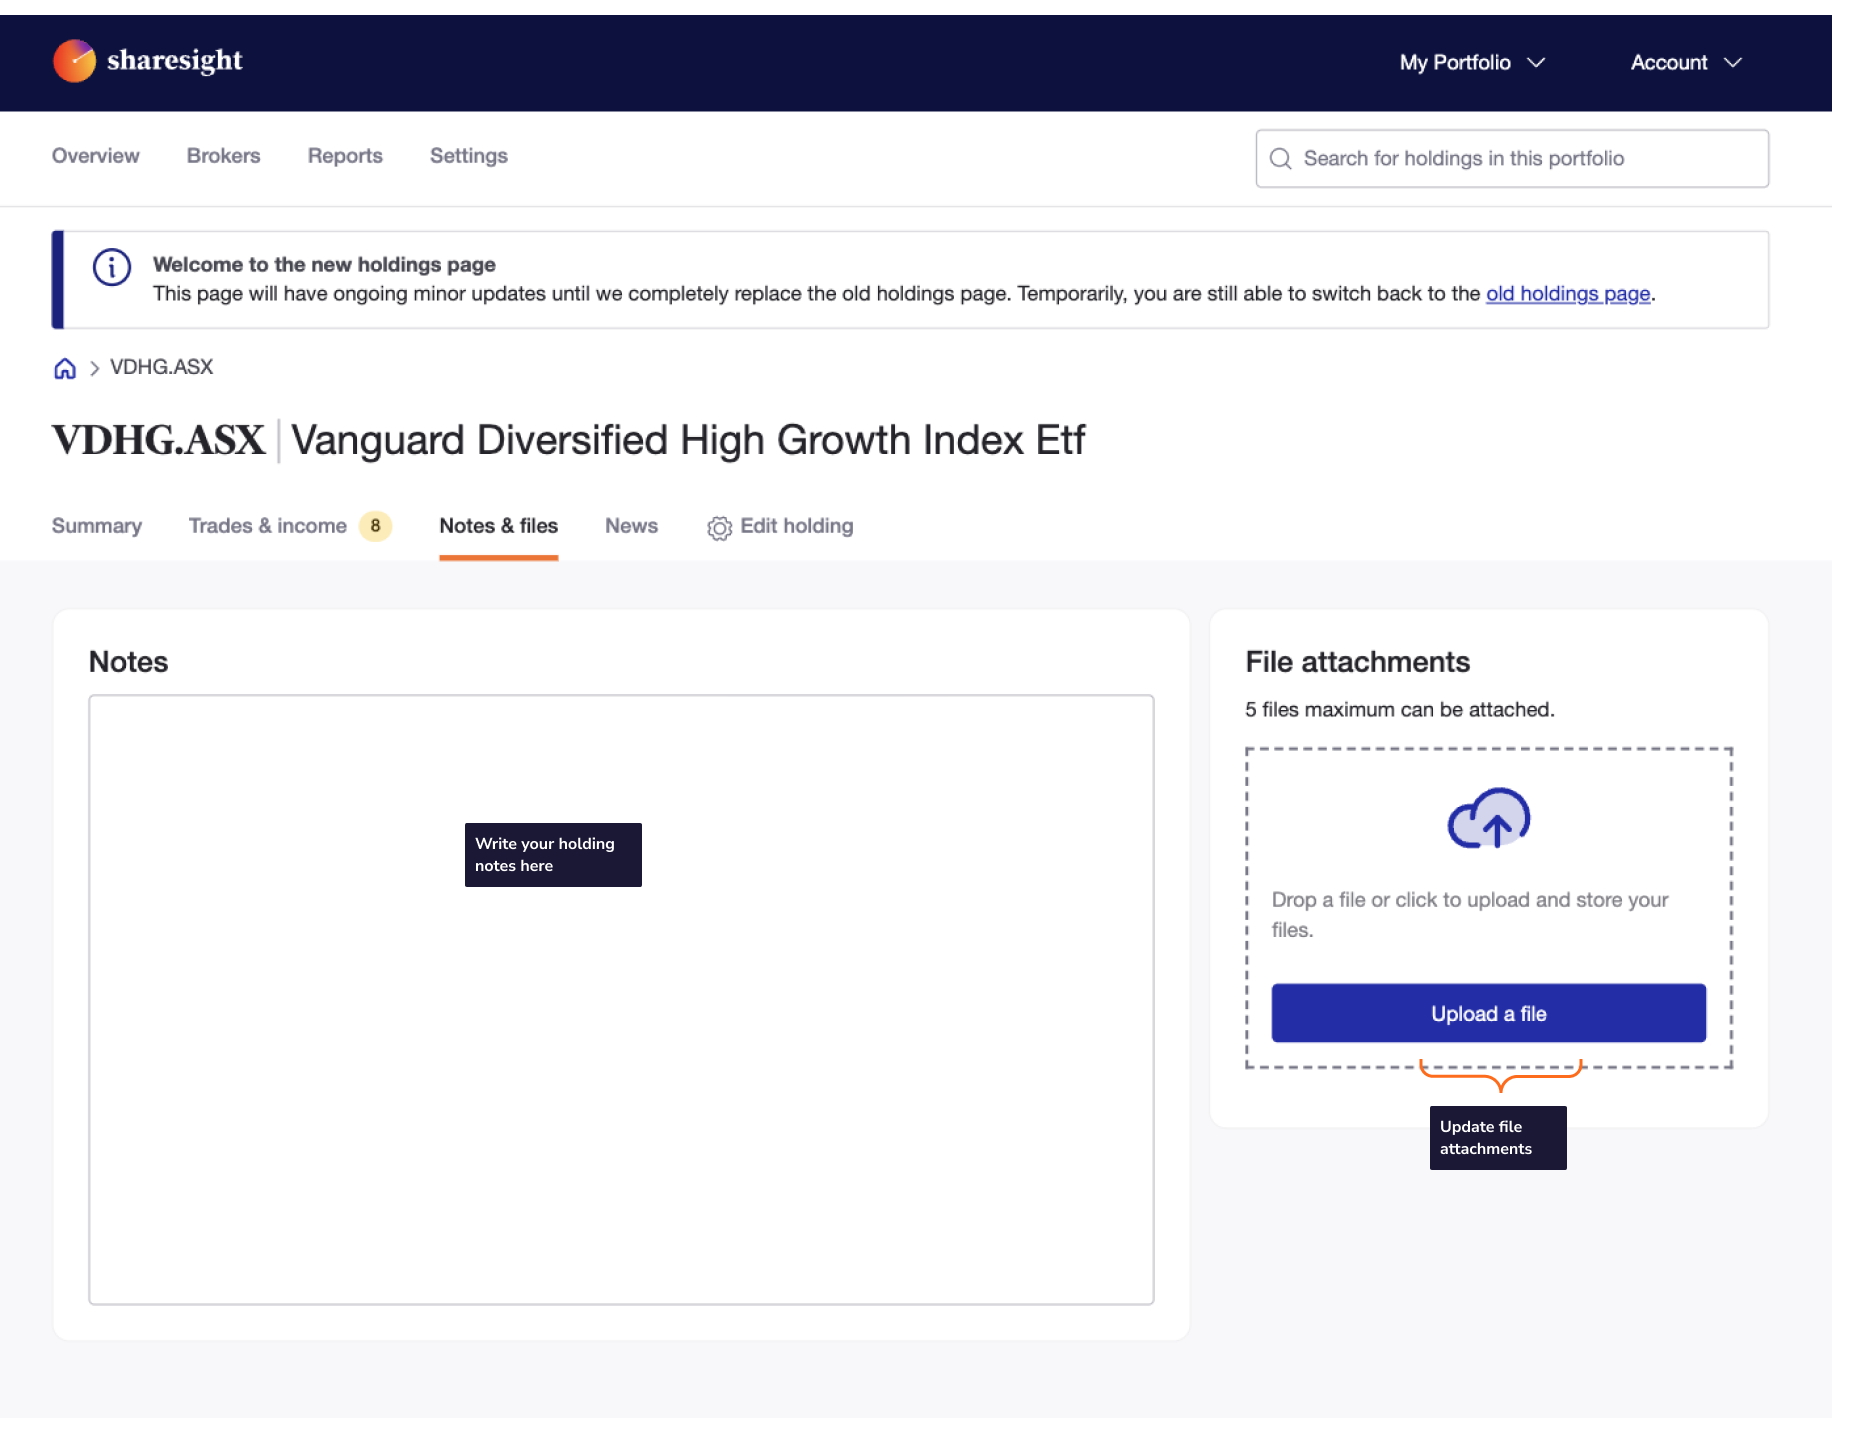
Notes & files
This is a notes area for you to add any notes on the holding for your record, e.g. you could make notes of goals for the holding or sale at X share price.
Attach files for your records and to have all your documentation in one place.
Holding News
This section provides news on the holding.
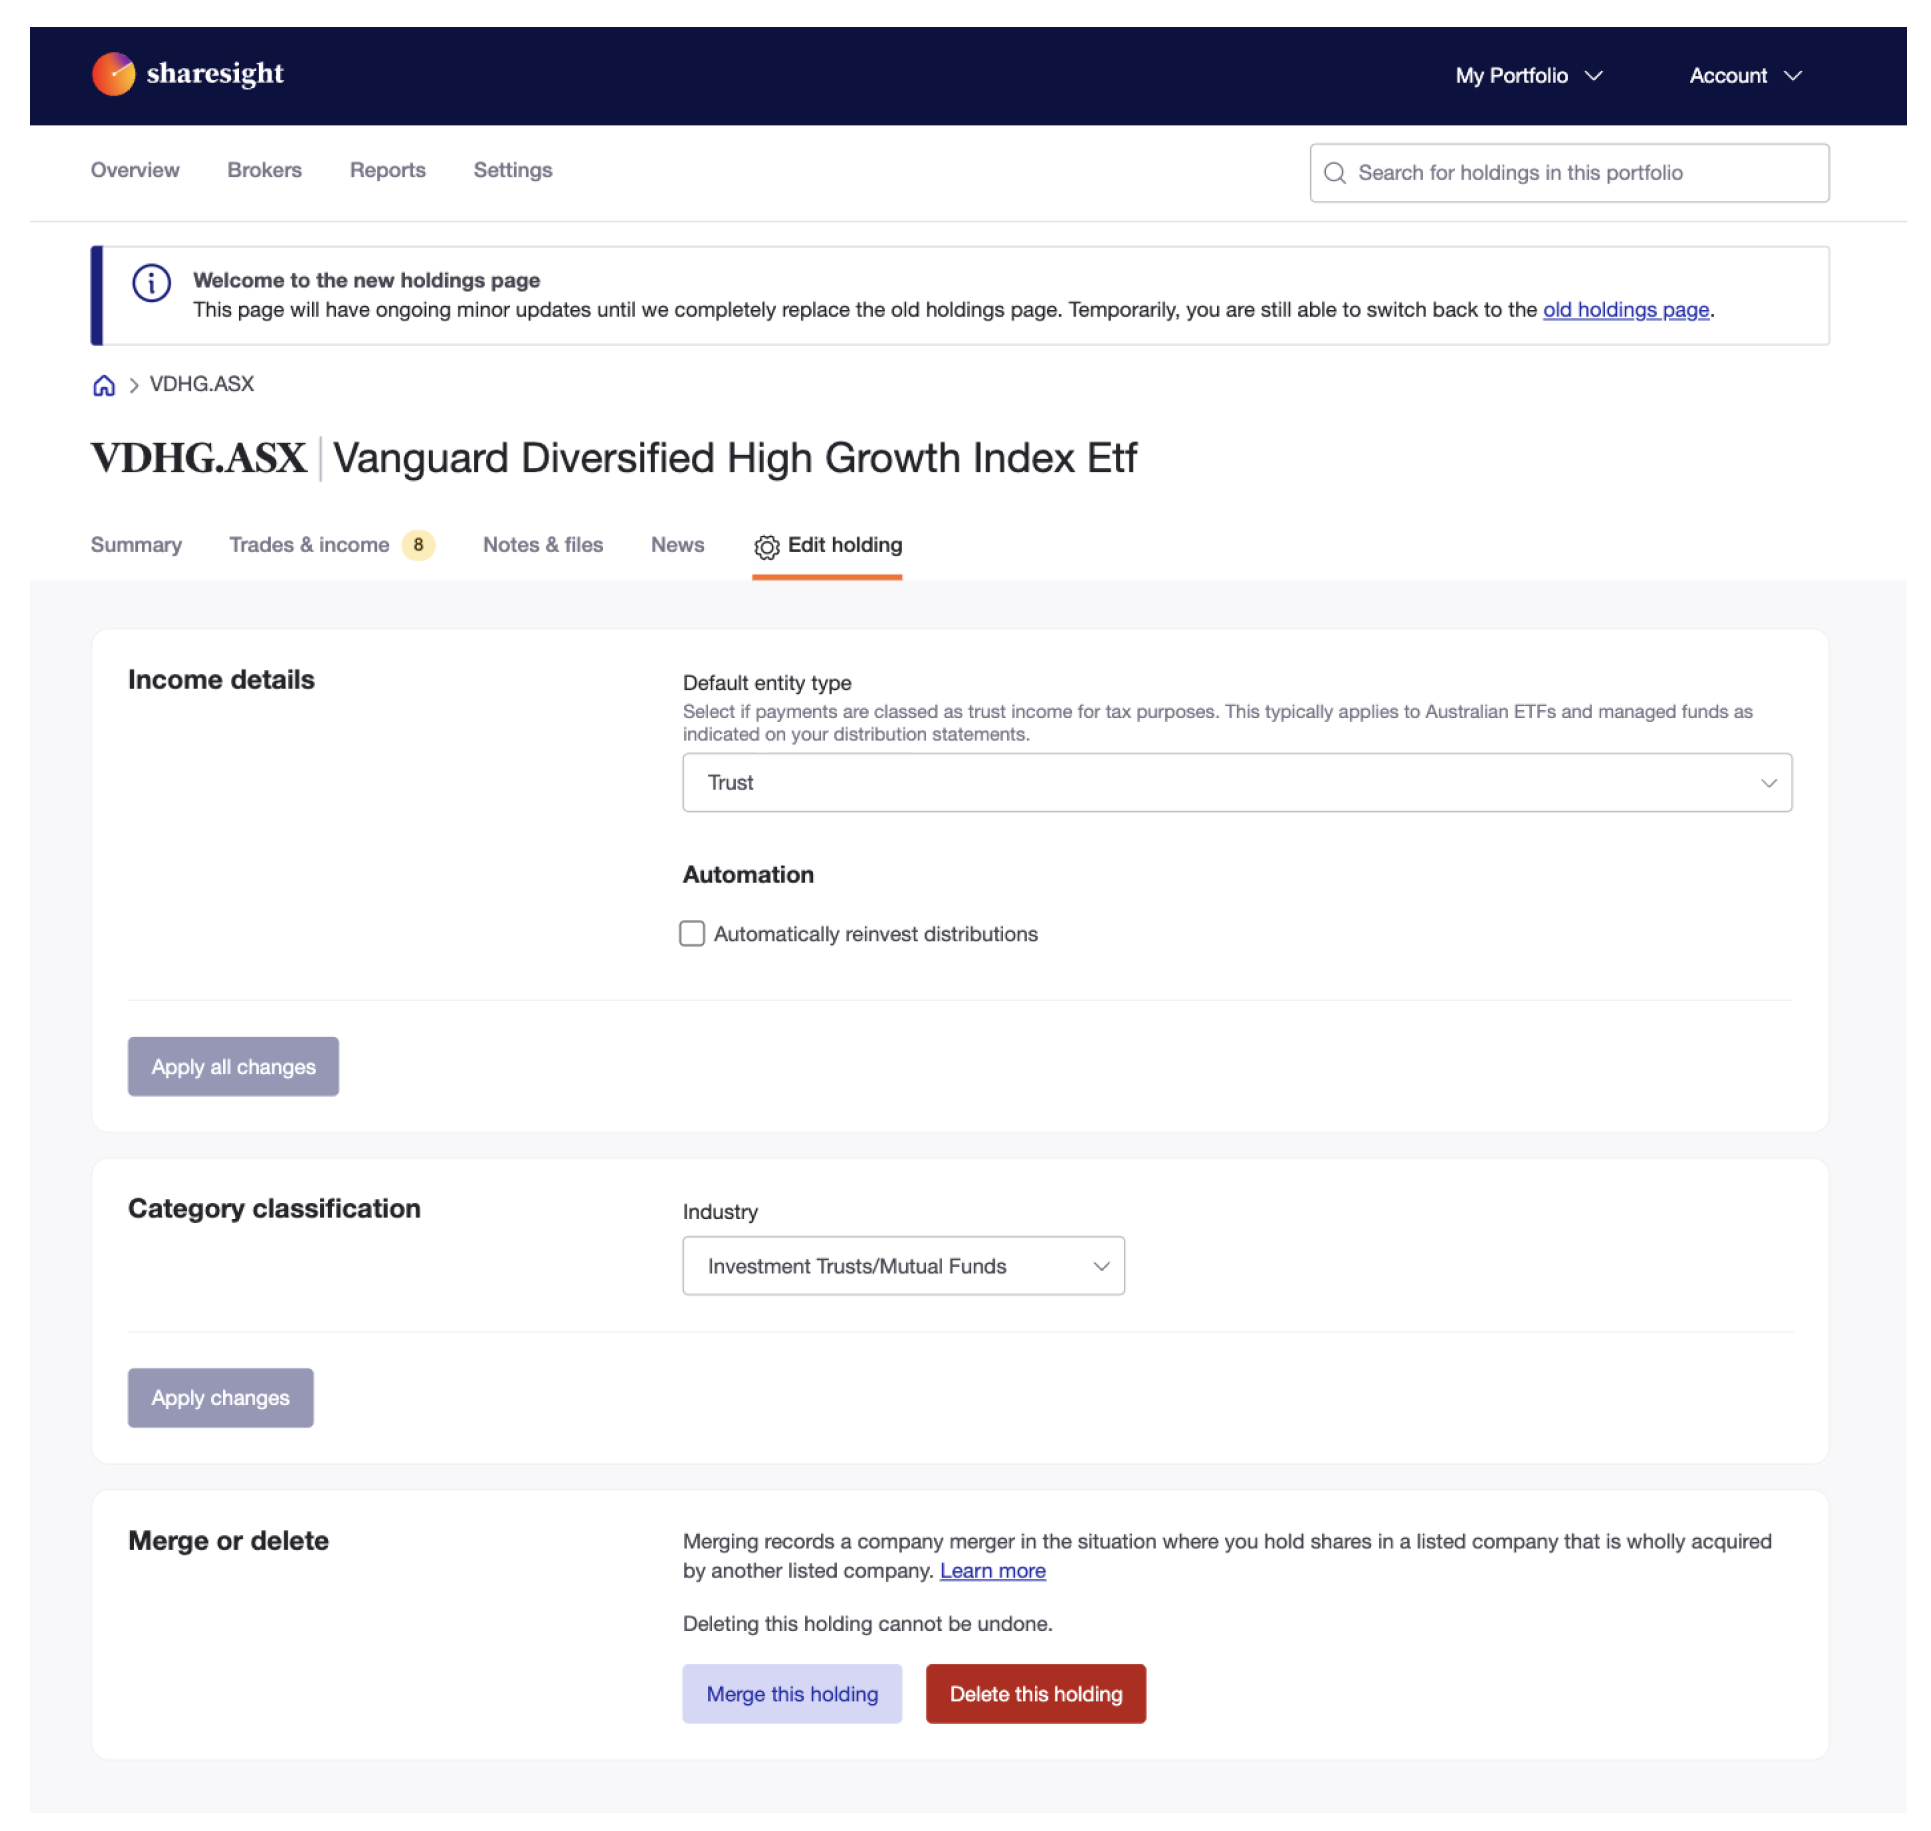
Edit holding
Contains settings for the holding:
- Income details - Select income type: Trust or Non Trust.
Set up an automatic Dividend Reinvestment Plan (Currently supported for DRP-enabled holdings listed on the ASX and NZX). Dividend reinvestments can be manually set up for all other markets.) For international holdings, set a foreign withholding tax percentage.
-
Price details - Enter a target price for the holding. Your target price then appears on the holding's price comparison.
-
CGT exemption (Australian portfolios only) - Exempt this holding from the CGT Report.
-
Broker/trading platform - Nominate a broker or trading platform for the holding. This is useful when setting up cash account sync.
-
Category Classification - Update the industry classification for the instrument.
-
Holding actions
- Merge this holding - Merge a holding that has been wholly acquired.
- Delete this holding - Note holdings cannot be restored once deleted.
Last updated 11th September 2026