How can we help?
Contribution Analysis Report
Available on Sharesight Standard, Premium and Sharesight Business plans.
The Contribution Analysis Report displays how each holding inside a Sharesight portfolio contributes to the overall portfolio performance. For each holding you can see capital gains, total return, dividends and currency gains in both dollar and percentage terms. The contribution figure itself — which shows how much each holding drove overall portfolio performance — is shown as a percentage only.
The report works excellent in combination with the Sharesight Custom Groups feature. The Custom Groups feature allows for asset allocation based on the portfolio owner's preferences. The Contribution Analysis Report in turn shows how each asset allocation has performed in comparison to the other asset allocations in the same portfolio.
Jump to:
Report overview
How to access the report
- From any page, click the Tools menu.
- Click Contribution Analysis Report under the Performance section.
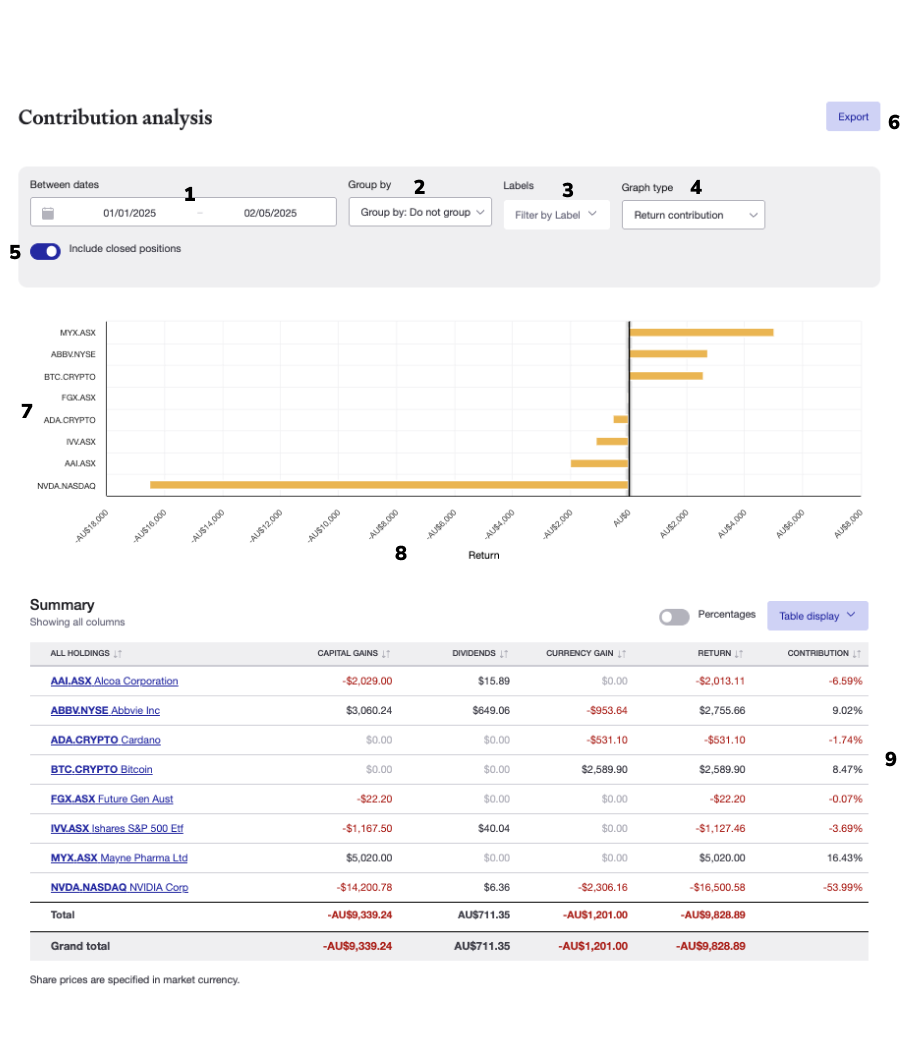
- Date range: click to expand and select your date range preferences.
- Group holdings with any of the 7 pre-set options: market, currency, sector classification, industry classification, investment type, country or no grouping. Or you can group by your Custom Groups.
- Group holding by label.
- Choose to show or hide the Contribution Analysis Graph. The graph is a horizontal bar chart showing each holding's contribution relative to the others.
- Click here to include or exclude your closed positions on the report.
- Download your report as a PDF, CSV or Google Drive document.
- The name of the asset allocation: the name changes if you change the Group By.
- The dollar amount the asset has contributed or deducted from the overall portfolio performance.
- The contribution of the asset to the overall performance in a percentage figure.
Understanding the columns
Capital Gains
The change in market value of a holding over the selected reporting period. It combines:
- Unrealised gains — the increase or decrease in value of holdings you still own
- Realised gains — profit or loss from any holdings sold within the reporting period
Capital gains does not include dividends or distributions — those are reported separately in the Dividends column.
Dividends
The total dividends and distributions received from the holding during the reporting period, including any franking credits.
Currency Gains
Applies only to foreign-denominated holdings — for example, US or UK shares held in an AUD portfolio. When the exchange rate between your portfolio's base currency and the investment's currency moves, the value of the holding in your portfolio changes even if the share price itself hasn't moved. This exchange rate impact is the currency gain or loss.
For example: if you hold US shares in an AUD portfolio and the USD strengthens against the AUD, your US holdings are worth more in AUD terms — that difference is recorded as a currency gain.
Total Return
The sum of capital gains, dividends and currency gains over the reporting period, shown in both dollar and percentage terms.
How contribution % is calculated
The contribution % shows how much each holding drove your portfolio's overall performance over the selected period. It is often misunderstood because the denominator uses absolute values — here is exactly how it works.
Each holding's total return includes:
- Capital gains (or losses)
- Dividends received
- Currency gains or losses (if applicable)
Formula
Contribution % = Individual holding's total return ÷ Sum of absolute returns of all holdings
The denominator sums every holding's total return as a positive number, regardless of whether the holding made or lost money. This means the contributions across all holdings will not always add up to 100% — a portfolio with both gains and losses will have contributions that sum to less than 100%.
Example
| Holding | Total Return | Absolute Value Used in Denominator |
|---|---|---|
| Holding A | +$500 | $500 |
| Holding B | −$200 | $200 |
| Holding C | +$300 | $300 |
| Total | +$600 | $1,000 |
- Holding A: $500 ÷ $1,000 = 50%
- Holding B: −$200 ÷ $1,000 = −20%
- Holding C: $300 ÷ $1,000 = 30%
The contributions sum to 60%, not 100%, because Holding B's loss added $200 to the denominator without contributing positively to the numerator.
Last updated 30th April 2026